


2024 Annual Results
|
2024 FY
(In RMB 100 million)
|
2023 FY
(In RMB 100 million)
|
YoY | |
|---|---|---|---|
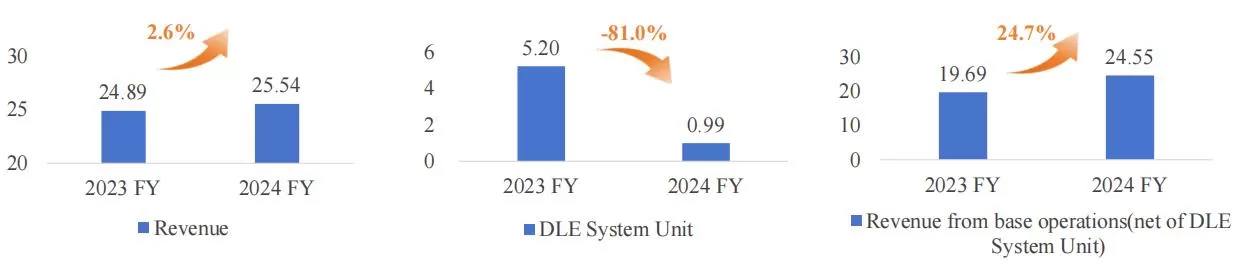
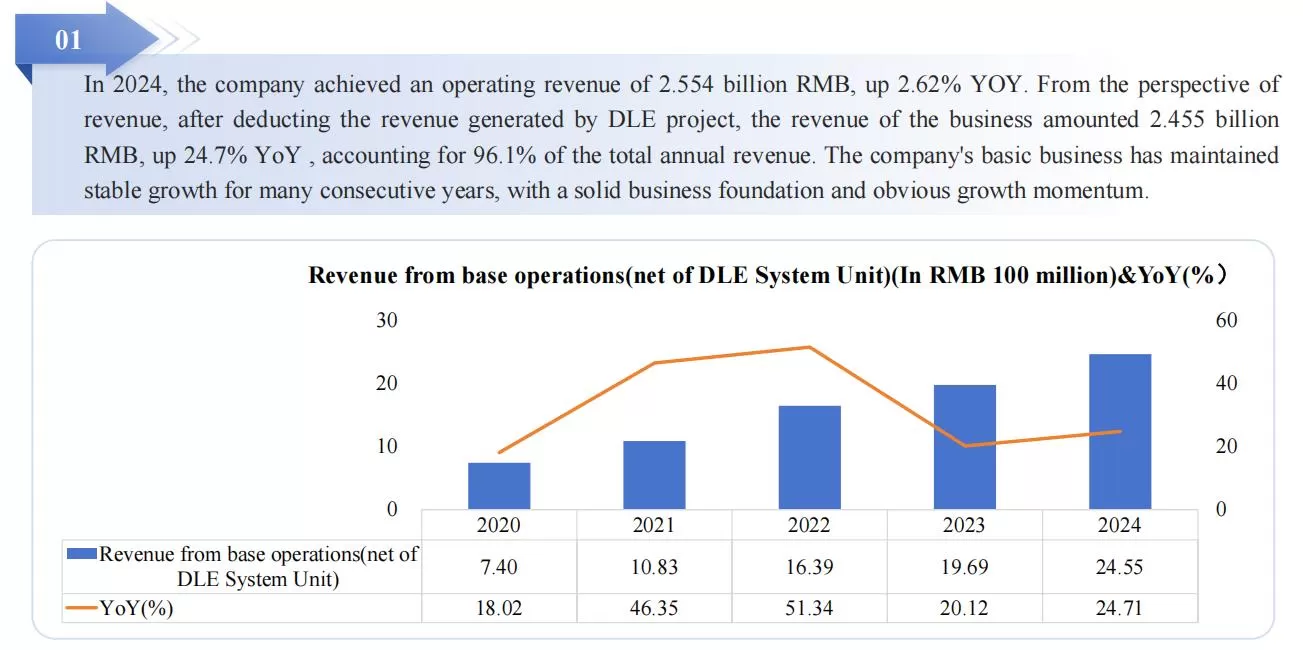
| Revenue | 25.54 | 24.89 | 2.6% |
| DLE System Unit | 0.99 | 5.20 | -81.0% |
| Revenue from base operations(net of DLE System Unit) | 24.55 | 19.69 | 24.7% |
| 2023 FY | 2024 FY | YoY | ||
|---|---|---|---|---|
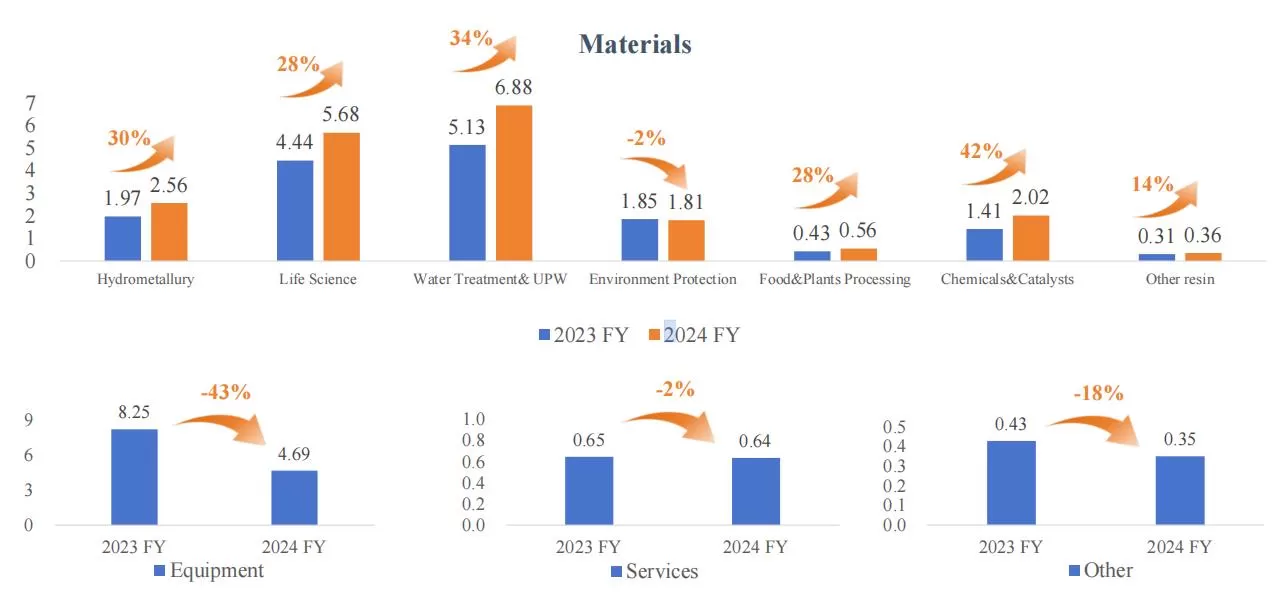
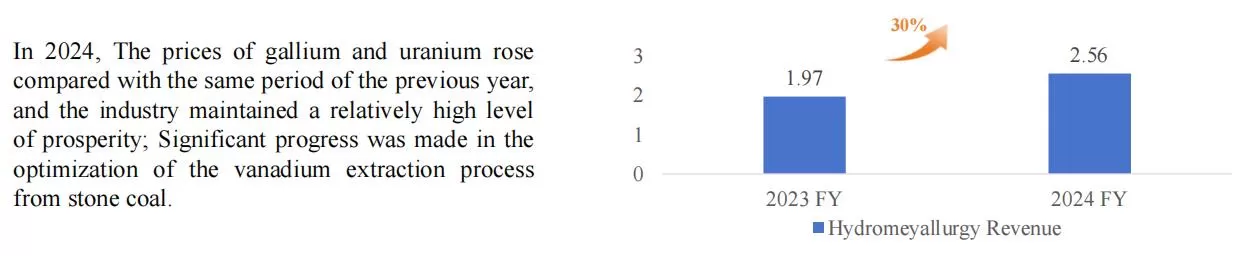
| Materials | Hydrometallurgy | 1.97 | 2.56 | 30% |
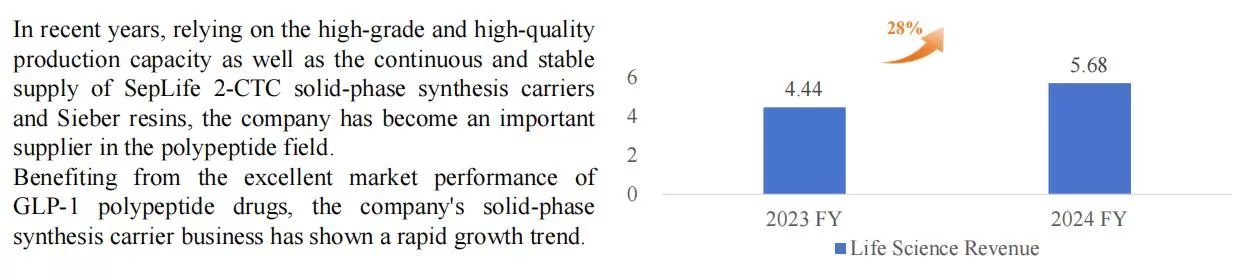
| Life Science | 4.44 | 5.68 | 28% | |
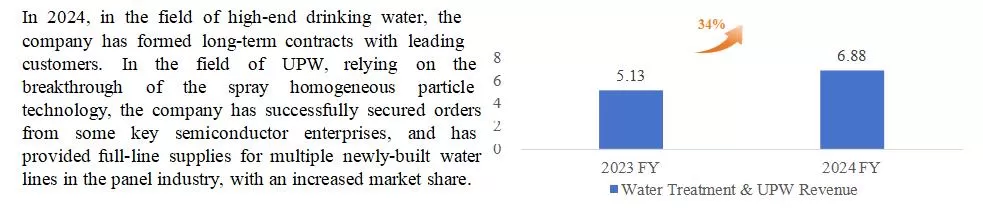
| Water Treatment & UPW | 5.13 | 6.88 | 34% | |
| Environment Protection | 1.85 | 1.81 | -2% | |
| Food & Plants Processing | 0.43 | 0.56 | 28% | |
| Chemicals & Catalysts | 1.41 | 2.02 | 42% | |
| Other resin | 0.31 | 0.36 | 14% | |
| Equipment | 8.25 | 4.69 | -43% | |
| Services | 0.65 | 0.64 | -2% | |
| Sum | 24.46 | 25.19 | 3% | |
| Other | 0.43 | 0.35 | -18% | |
| Total Revenue | 24.89 | 25.54 | 3% | |
◼ Revenue (In RMB 100 million)
|
2024 FY (In RMB 100 million) |
2023 FY (In RMB 100 million) |
YoY | Reason | |
|---|---|---|---|---|
| Revenue from Operations | 25.54 | 24.89 | 2.62% | No significant changes occurred |
| Cost of Goods Sold(COGS) | 12.90 | 12.78 | 1.00% | No significant changes occurred |
| Sales Expenses | 1.11 | 0.89 | 24.43% | No significant changes occurred |
| Administrative Expenses | 0.98 | 1.08 | -8.89% | No significant changes occurred |
| Financial Expense | -0.09 | -0.20 | 53.13% | Mainly due to the decrease in exchange gains during the reporting period. |
| Income Tax Expense | 1.13 | 0.96 | 17.49% | No significant changes occurred |
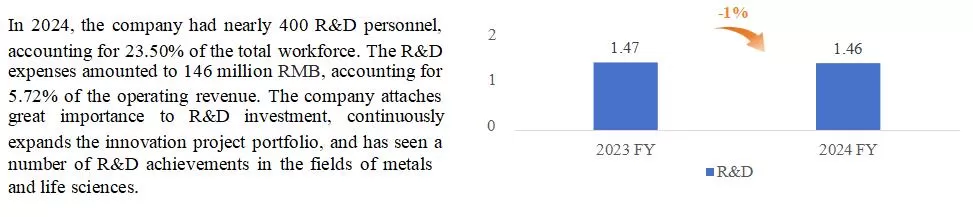
| R&D Expenses | 1.46 | 1.47 | -0.97% | No significant changes occurred |
| Net Cash Flow from Operating Activities | 7.32 | 6.69 | 9.34% | No significant changes occurred |
| Net Cash Flow from Investing Activities | -2.47 | -1.40 | -76.63% | Mainly due to the increase in the purchase of cash management products during the reporting period. |
| Net Cash Flow from Fundraising Activities | -3.92 | 4.25 | -192.09% | Mainly due to the issuance of convertible bonds in the same period of the previous year and the increase in dividend distribution during the reporting period. |
|
2024 FY (In RMB 100 million) |
2023 FY (In RMB 100 million) |
YoY | |
|---|---|---|---|
| Hydrometallurgy Revenue | 2.56 | 1.97 | 30% |
|
2024 FY (In RMB 100 million) |
2023 FY (In RMB 100 million) |
YoY | |
|---|---|---|---|
| Life Science Revenue | 5.68 | 4.44 | 28% |
|
2024 FY (In RMB 100 million) |
2023 FY (In RMB 100 million) |
YoY | |
|---|---|---|---|
| Water Treatment & UPW Revenue | 6.88 | 5.13 | 34% |
|
2024 FY (In RMB 100 million) |
2023 FY (In RMB 100 million) |
YoY | |
|---|---|---|---|
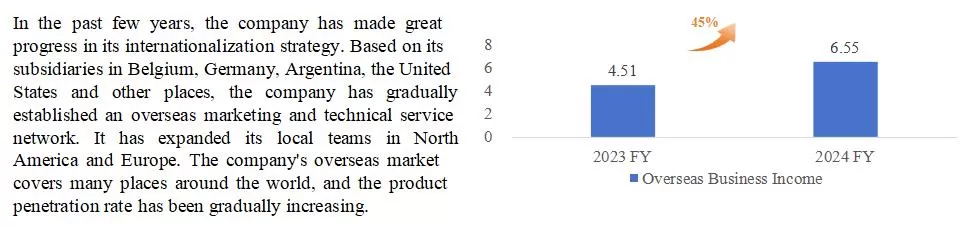
| Overseas Business Income | 6.55 | 4.51 | 45% |
|
2024 FY (In RMB 100 million) |
2023 FY (In RMB 100 million) |
YoY | |
|---|---|---|---|
| R&D Expense | 1.46 | 1.47 | -1% |
|
2024 FY (10000t) |
2023 FY (10000t) |
YoY | |
|---|---|---|---|
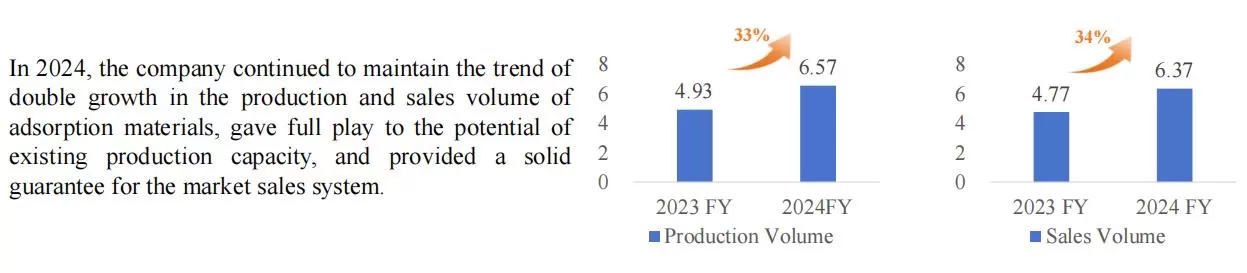
| Production Volume | 6.57 | 4.93 | 33% |
| Sales Volume | 6.37 | 4.77 | 34% |
| 2024-12-31 | 2023-12-31 | 2022-12-31 | 2021-12-31 | 2020-12-31 | |
|---|---|---|---|---|---|
| Current Assets | 45.00 | 42.31 | 31.90 | 19.15 | 13.83 |
| Fixed Assets | 6.85 | 6.97 | 7.51 | 6.42 | 6.73 |
| Cash and Cash Equivalents (By Currency) | 22.62 | 22.49 | 13.45 | 7.64 | 6.05 |
| Accounts Payable | 7.46 | 6.22 | 4.48 | 2.82 | 2.86 |
| Total Assets | 60.85 | 56.95 | 45.63 | 31.05 | 25.53 |
| YoY (%) | 6.85 | 24.59 | 46.97 | 21.60 | 13.29 |
| Current Liabilities | 15.82 | 17.13 | 17.09 | 8.17 | 6.95 |
| Contract Liabilities | 8.65 | 8.39 | 9.37 | 3.93 | 1.59 |
| Total Liabilities | 21.58 | 22.39 | 18.26 | 10.05 | 8.80 |
| YoY (%) | -3.61 | 22.61 | 81.66 | 14.22 | -9.55 |
| Shareholders' Equity | 39.27 | 34.56 | 27.36 | 20.99 | 16.73 |
| Equity Attributable to Parent Company Shareholders | 39.15 | 34.37 | 27.22 | 20.82 | 16.50 |
| YoY (%) | 13.89 | 26.26 | 30.74 | 26.16 | 30.85 |
| Unallocated Profit | 22.65 | 18.73 | 14.19 | 10.16 | 7.70 |
| 2024-12-31 | 2023-12-31 | 2022-12-31 | 2021-12-31 | 2020-12-31 | |
|---|---|---|---|---|---|
| Total Operating Revenue | 25.54 | 24.89 | 19.20 | 11.95 | 9.23 |
| YoY (%) | 2.62 | 29.62 | 60.69 | 29.51 | -8.82 |
| Total Operating Costs | 16.62 | 16.26 | 13.47 | 8.74 | 7.06 |
| Operating Income | 9.07 | 8.18 | 6.12 | 3.47 | 2.15 |
| YoY (%) | 10.89 | 33.70 | 76.41 | 61.51 | -24.43 |
| Total Profit / Loss | 9.07 | 8.17 | 6.12 | 3.47 | 2.17 |
| YoY (%) | 10.98 | 33.63 | 76.29 | 60.05 | -23.59 |
| Net Profit | 7.94 | 7.22 | 5.35 | 3.05 | 1.96 |
| YoY (%) | 10.11 | 34.88 | 75.02 | 56.21 | -21.18 |
| Net Profit Attributable to Parent Company Shareholders | 7.87 | 7.17 | 5.38 | 3.11 | 2.02 |
| YoY (%) | 9.79 | 33.35 | 72.91 | 53.85 | -19.59 |
| Non-recurring Gains and Losses | 0.42 | -0.06 | 0.48 | 0.14 | 0.20 |
| Net Profit Attributable to Shareholders of the Parent Company (after Non-recurring P&L) | 7.45 | 7.23 | 4.90 | 2.96 | 1.82 |
| YoY (%) | 2.99 | 47.63 | 65.27 | 63.08 | -26.28 |
| R&D Expenditure | 1.46 | 1.47 | 1.21 | 0.77 | 0.55 |
| EBIT | 8.90 | 8.34 | 5.17 | 3.38 | 2.69 |
| EBITDA | 10.22 | 9.63 | 6.22 | 4.36 | 3.59 |
| 2024-12-31 | 2023-12-31 | 2022-12-31 | 2021-12-31 | 2020-12-31 | |
|---|---|---|---|---|---|
| Cash Received from Sales of Goods and Services | 19.76 | 19.17 | 17.46 | 9.83 | 6.43 |
| Net Cash Flow from Operating Activities | 7.32 | 6.69 | 7.24 | 3.50 | 2.60 |
| Net Cash Flow from Investing Activities | -2.47 | -1.40 | -1.78 | -1.72 | -0.58 |
| Net Cash Flow from Fundraising Activities | -3.92 | 4.25 | -0.96 | 0.09 | -0.50 |
| Net Increase in Cash | 1.08 | 9.73 | 4.88 | 1.72 | 1.30 |
| EOP Cash Balance | 22.52 | 21.44 | 11.71 | 6.82 | 5.10 |
| Depreciation and amortization | 1.32 | 1.29 | 1.05 | 0.98 | 0.90 |
| 2024-12-31 | 2023-12-31 | 2022-12-31 | 2021-12-31 | 2020-12-31 | |
|---|---|---|---|---|---|
| Weighted ROE (%) | 21.33 | 23.12 | 22.63 | 16.43 | 14.86 |
| Diluted ROE after Non-recurring P&L (%) | 19.03 | 21.05 | 17.99 | 14.23 | 11.01 |
| ROE(TTM) | 20.11 | 20.86 | 19.75 | 14.93 | 12.24 |
| ROIC(%) | 19.23 | 21.68 | 21.32 | 14.28 | 11.71 |
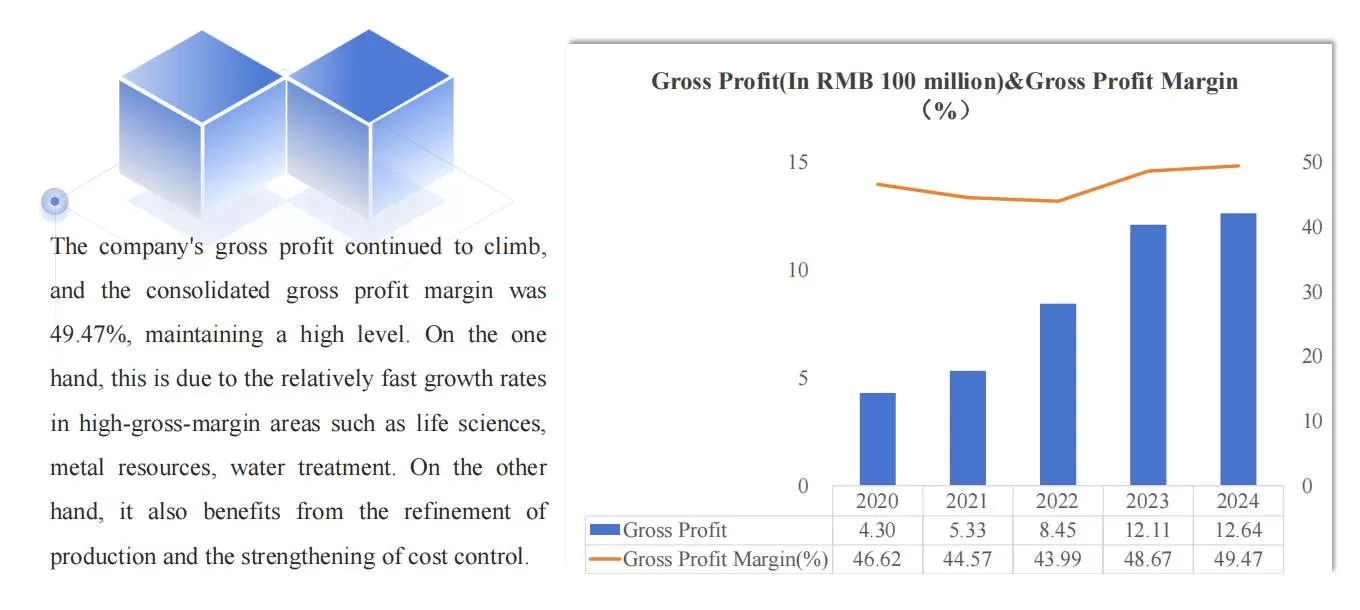
| Gross Profit Margin (%) | 49.47 | 48.67 | 43.99 | 44.57 | 46.62 |
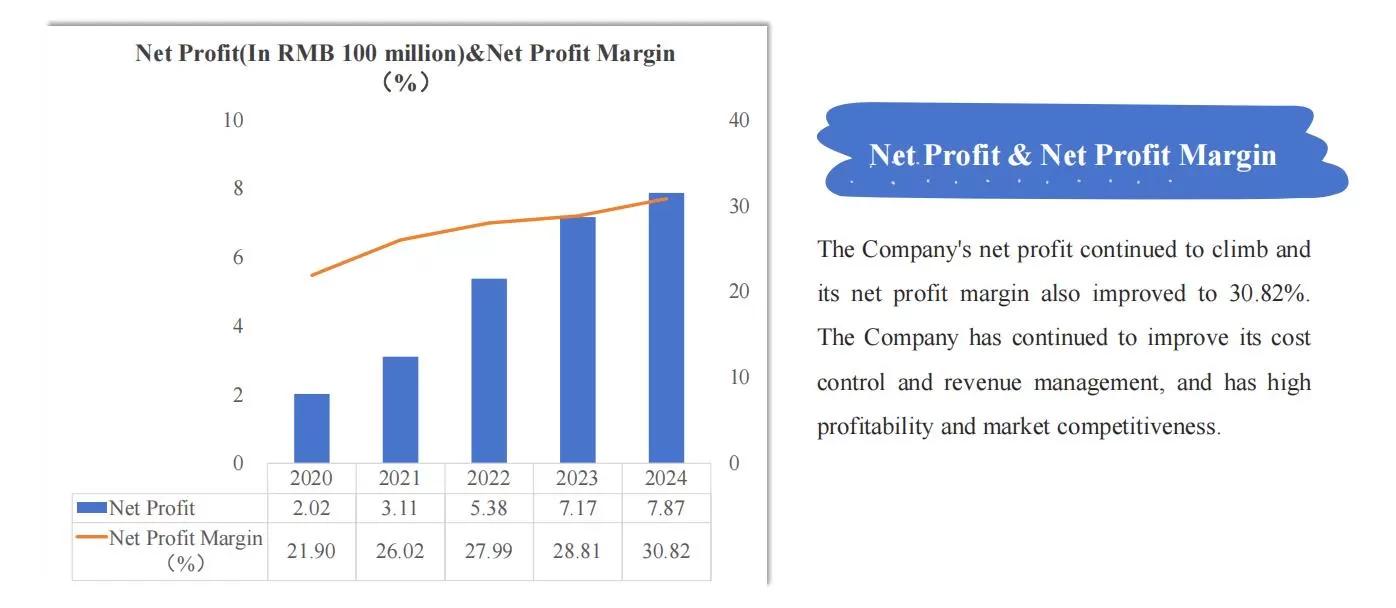
| Net Profit Margin (%) | 31.11 | 28.99 | 27.84 | 25.56 | 21.19 |
| Asset-liability Ratio (%) | 35.47 | 39.32 | 40.03 | 32.38 | 34.48 |
| 2024-12-31 | 2023-12-31 | 2022-12-31 | 2021-12-31 | 2020-12-31 | |
|---|---|---|---|---|---|
| Basic EPS | 1.56 | 1.43 | 1.63 | 1.43 | 0.97 |
| Diluted EPS | 1.55 | 1.41 | 1.60 | 1.42 | 0.97 |
| EPS (Diluted) | 1.55 | 1.42 | 1.60 | 1.41 | 0.94 |
| Basic EPS after Non-recurring P&L | 1.48 | 1.44 | 1.48 | 1.37 | 0.88 |
| BPS | 7.37 | 6.46 | 8.12 | 9.39 | 7.61 |
| Sales Per Share (SPS) | 5.03 | 4.93 | 5.73 | 5.44 | 4.30 |
| Operating Cash Flow Per Share (OCFPS) | 1.44 | 1.33 | 2.16 | 1.59 | 1.21 |
| Cash Flow Per Share (CFPS) | 0.21 | 1.93 | 1.46 | 0.78 | 0.61 |
| FCFF Per Share | 0.70 | 0.99 | 2.00 | 0.31 | 0.86 |
| P/E (TTM) | 30.54 | 36.11 | 60.28 | 78.43 | 51.60 |
| P/B (MRQ) | 6.84 | 8.75 | 9.64 | 10.93 | 6.01 |
| P/S(TTM) | 8.66 | 11.55 | 15.74 | 19.11 | 11.31 |
Q1:What about the capital expenditure in the future?
A1:In 2024, the company continued to maintain the upward trend in both production and sales
volume of its adsorption materials. The total production volume reached 65,700 tons, up 33.4%
YOY. The sales volume was 63,700 tons, up 33.6% YOY. The company has fully exploited the potential of its existing production capacity, providing a solid guarantee for its market sales system.
In July 2024, the company convened a general meeting of shareholders, which reviewed and approved the "Proposal on the Wholly-owned Subsidiary's Intention to Purchase the Right to Use Land and Invest in the Construction of a High-end Material Manufacturing Industrial Park". It is planned to build a production capacity of 20,000 tons of high-end materials to meet the demands of the high-end application market, covering adsorption and separation materials for high-value-added products such as ultrapure water and food.
In the future, the company will also make an overall plan for production capacity in multiple
fields and regions in combination with its overall strategy and changes in the macro environment.
Q2:What is the company's expected future dividend situation?
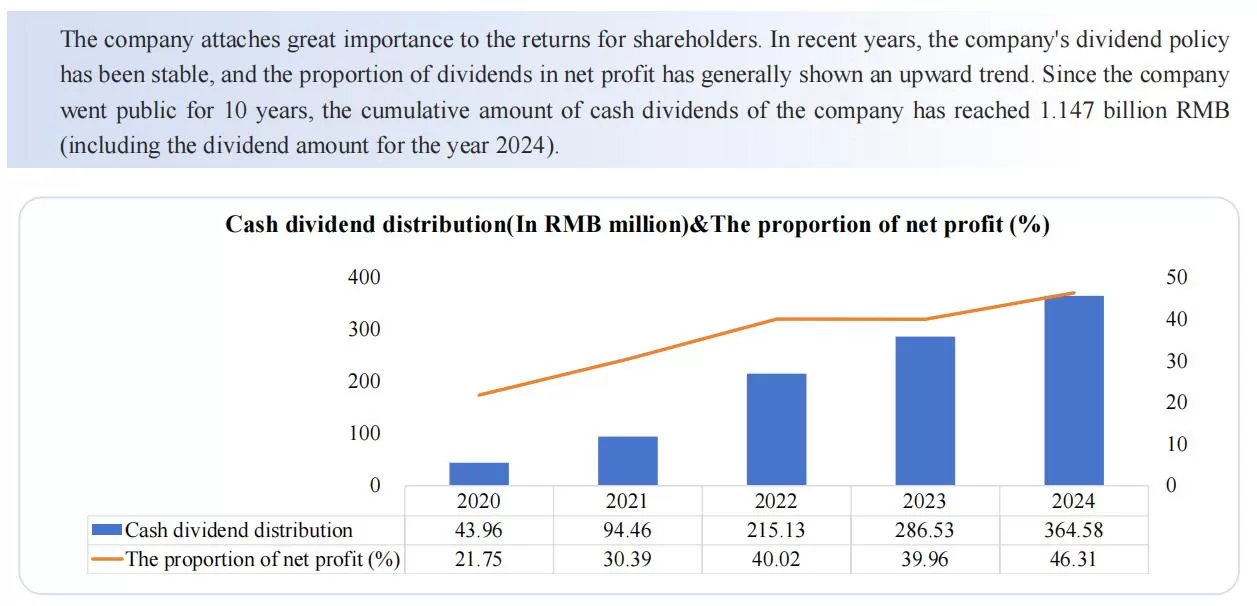
A2:The company actively responds to the call of policies and effectively gives back to the
majority of investors. The cash dividends of the company for the year 2024 include the annual
cash dividends (which still need to be reviewed by the general meeting of shareholders) and the cash dividends for the first three quarters of 2024. It is expected that the cumulative cash dividends will amount to 365 million RMB, and the total amount of cash dividends distributed accounts for 46% of the net profit attributable to the shareholders of the listed company in the consolidated financial statements for 2024. The overall dividend plan of the company for the year 2024 does not mean that the company will distribute dividends at this fixed ratio every year. The dividend plan for future years will be determined according to the specific circumstances at that time.
Q3:How will the company balance the resource allocation between the domestic and overseas markets in the future?
A3:In 2024, the company achieved overseas sales revenue of 655 million RMB, representing a substantial year-on-year increase of 45.1%, which is significantly higher than the growth of domestic business. Internationalization has always been the company's adhered-to strategy and
also an important sustainable competitive advantage. In recent years, the company has gradually made breakthroughs in key overseas markets, and the penetration rate of overseas markets has been increasing gradually. The reputation of the Sunresin brand has been further established. The company's overseas market has been systematically expanded from major customers and key regions and steadily advanced, covering regions including North America, Europe, Asia, South America, Africa and other areas. In 2024, the company established a wholly-owned subsidiary in the United States and set up warehousing units in North America and Europe to further improve operational efficiency and build a platform for promoting the localized development of its business.
Q4:What are the demand increment and market share of the company's solid - phase synthesis carriers?
A4 : The incremental demand for solid-phase synthesis carriers mainly comes from the substantial growth in the sales volume of GLP-1 polypeptide drugs. According to preliminary statistics, the market share of the company's polypeptide solid-phase synthesis carriers remains at a relatively high level. In the past two years, the market pattern of polypeptide solid-phase synthesis carriers has been relatively stable, and the company has always been a mainstream supplier in the market.

Contact Us


